Facial proportions: the drawing rules, the measured averages, and which ones you can check
·15 min read·Updated
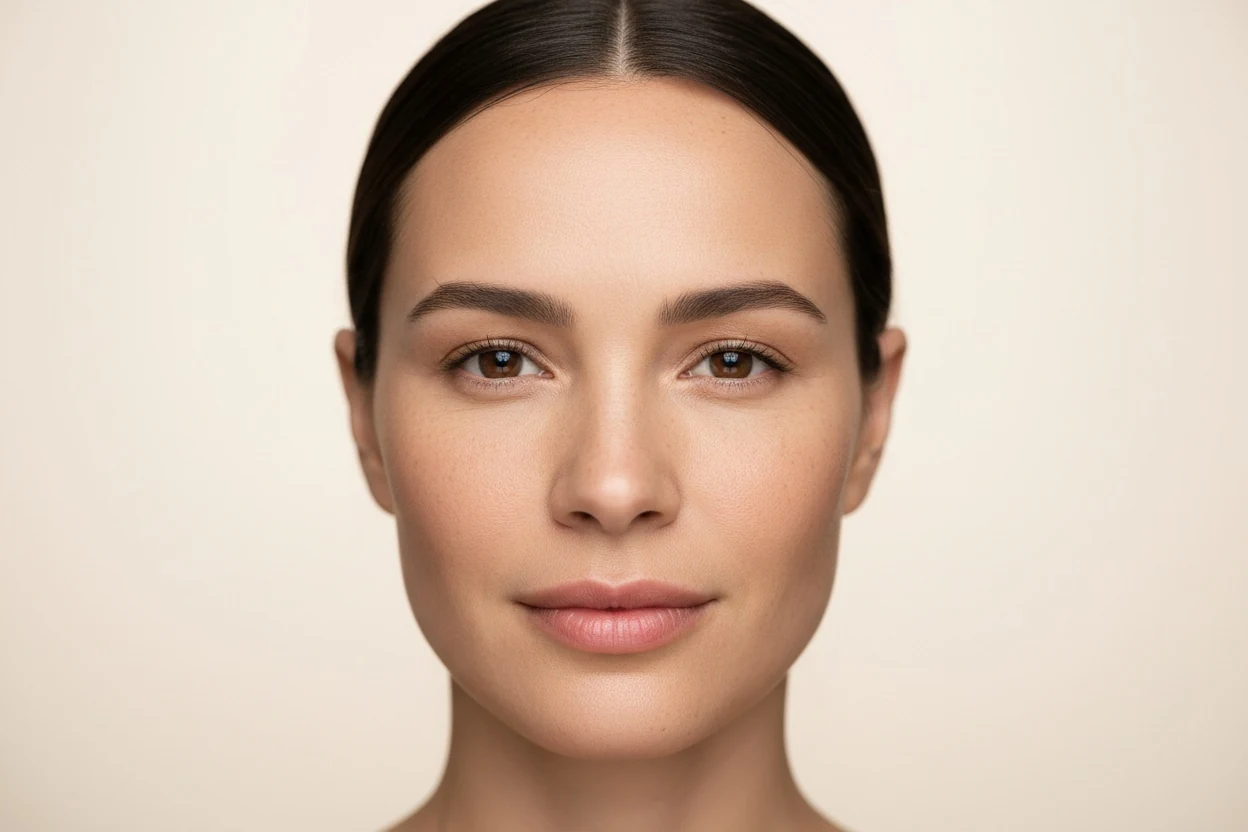
Every article about facial proportions quotes the same three rules — thirds, fifths, and the golden ratio — as if they were one coherent system handed down from antiquity. They are not. They come from different centuries, they make different claims, and only some of them survive contact with a measuring tool. This is what each one actually says, where it came from, and which parts of it you can check on your own face in about a minute.
What facial proportions actually are
A facial proportion is a ratio between two distances on the same face. That last part is the whole point: a ratio needs no scale. It does not matter how far you stood from the camera or what lens you used, because both distances shrink or grow together. This is why almost everything on this site is reported as a ratio, and why pupillary distance — a genuine millimetre figure — is the odd one out, only measurable because the iris happens to be a near-constant 11.7 mm across adults.
It also explains why proportion rules are stated the way they are. Nobody says an attractive nose is 47 mm long. They say the lower third should equal the middle third, because that comparison holds whatever size the head is.
The rule of thirds: the oldest facial proportion
Divide the face horizontally at three landmarks — the hairline, the brow line, and the base of the nose — and you get three bands running down to the chin. The classical canon, formalised in Renaissance drawing manuals and still taught in life-drawing classes today, says the three should be roughly equal.
In practice the upper third is the unreliable one, because it is bounded by a hairline rather than by bone. A receding hairline lengthens it, a fringe hides it, and pulling hair back changes the number you get. Surgeons who use thirds in planning often skip it for exactly this reason and work from the brow down.
The lower third has an internal division of its own: from the base of the nose to the lip line should be about a third of it, and lip line to chin the other two thirds. That upper segment is the philtrum, and it is the one part of face height that reliably lengthens with age.
The facial thirds calculator measures all three bands from one photo and tells you which one not to trust when your hairline is hidden.
Measure your thirdsThe rule of fifths: face width in eye widths
The vertical counterpart divides face width into five columns, each one eye wide. Columns two and four are the eyes themselves. Column three is the gap between them — the rule says the intercanthal distance equals one eye width — and the outer columns run from the outer corner of each eye to the edge of the face.
This one is more measurable than the thirds, because every boundary sits on a corner of an eye rather than on hair. It is also where two common labels come from: when the central column is clearly wider than one eye, the eyes read as wide-set; clearly narrower and they read as close-set. Both are the same measurement, reported in opposite directions, and neither is a defect.
| Column | What it spans | Reliable in a front photo? |
|---|---|---|
| 1 and 5 | Outer eye corner to the edge of the face | Only if the head is straight on — this is the first thing head rotation distorts |
| 2 and 4 | The eyes themselves, corner to corner | Yes |
| 3 | The gap between the inner corners | Yes — and it is the basis of eye spacing |
Facial proportions for drawing vs what real faces measure
If you are here to draw faces, the classical proportions are exactly what you need: a construction grid that produces a believable head. The usual set is eyes about halfway down the head, the base of the nose halfway between brows and chin, one eye width between the eyes, mouth corners under the pupils, and ears spanning brow line to nose base. If you are here to measure a face, the more useful question is how often real faces follow those rules — and that has been tested.
In 1985 Farkas and colleagues measured 153 young adults and checked nine neoclassical canons against them. The results are the best available answer to how much the drawing rules describe people:
| Classical rule | What it says | What the measurements found |
|---|---|---|
| Eye gap equals nose width | The distance between the eyes matches the width of the nose | The best fit of the nine — true in 40% of young adults |
| Nose width is a quarter of face width | Four nose widths span the face | True in 37% |
| Vertical profile canons, including equal thirds | The sections of the head and face are equal in height | The worst fit. Equality was found for no more than two of the sections, never the full set |
| All nine together | A description of the ideal face | Large variability in feature size; the canons may fit a few people but do not describe the average face |
| The golden ratio (a later addition) | Facial ratios approach 1.618 | In a 2015 study of 100 adults, nearly every ratio measured differed significantly from phi in both sexes |
The same study found that sex did not significantly change how often the canons fitted, while age did — the rules fit a six-year-old, a twelve-year-old and an eighteen-year-old differently. For drawing, that is a reason to use the grid as scaffolding and then look at the actual face. For measuring, it is a reason to treat any distance from the canon as description rather than deviation.
Where the golden ratio fits into facial proportions
The golden ratio, phi, is approximately 1.618. Unlike the thirds and the fifths it describes an unequal division, and it arrived in this subject far later — its systematic application to faces dates to the 1990s, most visibly through Stephen Marquardt's phi mask, which overlays a decagonal grid built from phi onto a photograph.
The mask is genuinely striking when it lines up, and that is most of its persuasive power. It also has a documented problem: Holland's 2008 analysis in Aesthetic Plastic Surgery found the mask was derived from a narrow set of fashion models and fits some populations far better than others, which makes it a description of one aesthetic rather than a universal constant. Quoting phi as though it were a law of biology skips that finding entirely.
The calculator reports the actual ratios your face produces and how far each sits from 1.618 — including the ones that miss, which is the interesting half.
Measure your face against phiAverage facial proportions by sex and ancestry
Anthropometry, the measurement of the body, has produced large reference sets for the face — the best known being Farkas's normative data for North American adults. What those data show about differences between groups is more modest, and more useful, than most proportion charts suggest.
Female vs male facial proportions
Men's faces are larger on average in absolute terms, but proportions are ratios, and ratios move much less. In the 1985 test of the classical canons, sex did not significantly change how often any rule fitted. Studies of specific populations do find differences in a handful of individual ratios — one study of 100 South Indian adults found significant sex differences in three of eleven ratios, including one involving nose width — but the ranges overlap so much that no ratio sorts a face into female or male. Facial proportions female and male are, for practical purposes, measured on the same scale.
Why a single "ideal" doesn't travel across populations
An international study led by Farkas measured 14 facial dimensions in 1,470 young adults from groups in Europe, the Middle East, Asia and Africa and compared them with North American white norms. Some measurements, such as mouth width, were near-identical across groups; others, particularly nose width and height and the region around the eyes, differed. The authors described their samples as small and the study as preliminary. The point for anyone reading an "ideal proportions" chart is where the ideal came from: canons drawn from one population, or a phi mask built from a narrow set of fashion models, describe that source rather than faces in general.
Facial proportions and attractiveness: what the research supports
Three findings recur across the literature and are worth separating from the folklore around them.
- Averageness. Langlois and Roggman (1990) found that composite faces — many faces mathematically averaged together — are rated more attractive than most of the individual faces that went into them. The effect is robust and repeatedly replicated. It also implies something people find counterintuitive: unusual proportions cost more than they gain.
- Symmetry. Grammer and Thornhill (1994) reported a correlation between facial symmetry and rated attractiveness. The correlation is real and modest. Perfect symmetry is not the goal state — nobody has it, and faces made artificially symmetrical tend to be rated as slightly uncanny.
- Skin, not geometry. Fink, Grammer and Matts (2006) found that skin colour distribution alone shifted ratings of age, health and attractiveness, with no change to the underlying shape. In several studies of this kind, skin outperforms proportion.
The golden ratio fares worst of all under measurement. When researchers measured six horizontal and seven vertical ratios on 100 adults and compared each with phi, almost all of them differed significantly from 1.618 in both women and men, and the authors concluded phi should not be treated as the measure of facial beauty. Rhodes' 2006 review in the Annual Review of Psychology is the standard summary if you want one source: averageness, symmetry and sexual dimorphism all contribute, all with modest effect sizes, and none of them behaves like the single lever the popular accounts describe.
Proportion explains part of the variance in how faces are rated. It has never explained most of it, and no published result claims that it does.
How to measure your own facial proportions
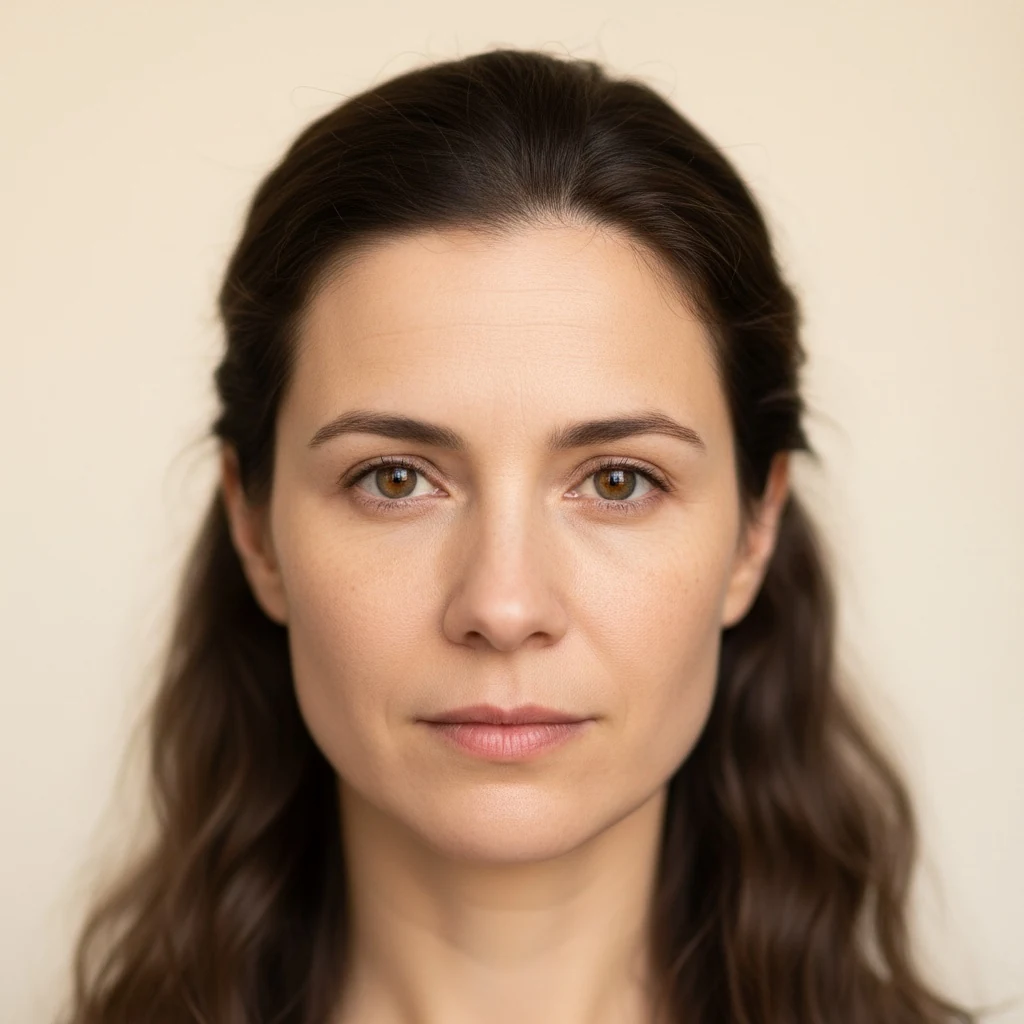
You need one photo taken straight on, at eye level, with even light on both sides. Head rotation is the dominant error source — a turn of ten degrees changes every horizontal ratio on this page while leaving the vertical ones alone, which is exactly the pattern that makes two runs disagree in a way that looks mysterious.
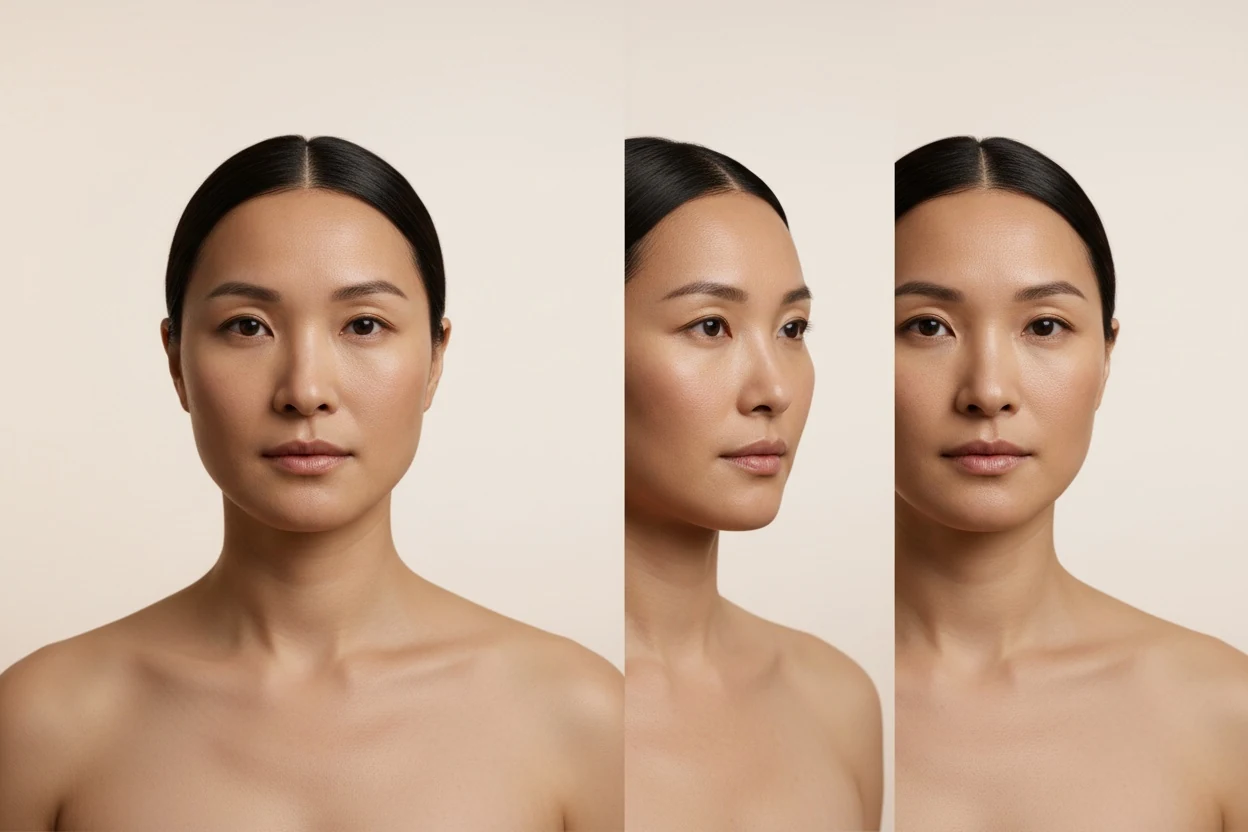
- Hold the camera at eye level, not above or below. A raised camera shortens the lower third; a lowered one lengthens it.
- Face the lens squarely. If one ear shows more than the other, you are turned.
- Relax your expression and close your mouth. A smile moves the lip line and shortens the lower third.
- Pull hair off the forehead if you want the upper third to mean anything.
- Compare the three vertical bands, then the five columns. Differences under about five per cent are not visible to anyone, including you.
The analysis places 478 landmarks in your browser and reports the thirds, the fifths, symmetry and the phi comparisons together, with the landmark each number came from. Your photo is not uploaded.
Run the measurementsFacial proportions a front photo cannot measure
This is the part the drawing guides leave out, because a drawing can simply choose a profile. A single front photo carries no depth information at all, and several of the proportions people most want are depth measurements.
| Proportion | Why the front view fails | What it needs |
|---|---|---|
| Nasofrontal and nasolabial angles | Both are angles measured in the sagittal plane, which is edge-on in a front photo | A true profile shot |
| Orbital depth | Whether the eye sits deep or forward is invisible when you are looking straight into it | A three-quarter or profile view |
| Chin and lip projection | Forward distance cannot be recovered from a flat frontal image | A profile shot |
| Any absolute size in millimetres | A photo has no scale | A reference object — or the iris, which is why PD works |
Four of the seven named nose types are defined by exactly these profile traits, which is why that page tells you which of them it can and cannot decide from your photo instead of picking one anyway.
Facial proportions in profile
Drawing a face from the side uses a different set of reference lines, and clinicians use the same ones to describe a profile. None of them can be taken from a front photo.
| Measure | What it is | What is known about it | Front photo? |
|---|---|---|---|
| E-line | A straight line from the tip of the nose to the front of the chin, used to judge where the lips sit | Proposed by the orthodontist Robert Ricketts in 1968 as a reference for lip position | No |
| Nasolabial angle | The angle between the underside of the nose and the upper lip | Often quoted as 90–120°; in one rating study the preferred angle averaged about 96° for men and 98° for women | No |
| Nasofrontal angle | Where the bridge of the nose meets the forehead | Describes how deep the dip is between brow and nose; it is what the Greek nose profile refers to | No |
| Chin projection | How far the chin sits forward relative to the lips and nose | Assessed against lines like the E-line rather than as a single number | No |
How your facial proportions shift as you age
Faces change proportion most in childhood and again, more slowly, in later adulthood. Growth changes the face's proportions through childhood and adolescence, which is why the classical canons fit children and young adults differently. In adulthood the changes come from two directions at once.
- Bone. The facial skeleton keeps remodelling: the maxilla loses projection, the opening around the nose widens and the orbital rim recedes, so the scaffold under the soft tissue changes shape.
- Soft tissue. Midface volume shifts, which changes how the middle and lower thirds read. The upper lip gets longer with age and shows less of its red vermilion, so the philtrum takes up more of the lower third.
- What stays. Bone-set widths, such as the distance between the pupils, are effectively fixed after growth. That is why width ratios are more stable across a lifetime than height ratios.
If you are comparing your proportions against a photo from ten years ago, the lower third is where to expect a difference, and camera height is the thing to hold constant before believing it.
Celebrity "perfect face ratio" claims, and why they can't be checked
The most-shared example dates from October 2019, when London cosmetic surgeon Julian De Silva announced that computerised mapping had found Bella Hadid's face 94.35% accurate to the golden ratio, followed by a ranked list of other celebrities. The claim spread widely and still circulates every year with new names.
Three things make figures like this impossible to verify. The coverage did not publish the method, the landmarks or the photographs used, so nobody can repeat the measurement. Celebrity photographs vary in pose, lens, lighting and retouching, and each of those shifts ratios by more than the gaps between the ranked names. And the standard being measured against is the golden ratio, which measured faces mostly do not follow. This page does not measure or show any public figure's face; the golden ratio calculator measures your own photo, where you control the camera.
Proportions by feature
Each feature has its own conventions, its own measurable ratios and its own blind spots. These pages carry the arithmetic for each one:
| Feature | The ratio that defines it | Page |
|---|---|---|
| Face outline | Length against width, plus jaw against cheekbone width | The seven face shapes |
| Eyes | Lid space, aperture, spacing and canthal tilt in degrees | The ten eye shapes |
| Eye corner angle | Inner corner against outer corner, as an angle | Canthal tilt |
| Nose | Width against face width, length against width | The seven nose types |
| Lips | Upper against lower lip, Cupid's bow depth, corner angle | Lip shapes |
| Jaw | Jaw width against cheekbone width | Jawline rating |
| Philtrum | The groove length against lower-third height | Philtrum |
| Eye distance | The only measurement here in real millimetres | Pupillary distance |
What to do with the numbers
Almost nothing, most of the time. A face that misses equal thirds by four per cent is a face nobody will ever describe as disproportionate, because four per cent is below the threshold at which anyone sees it. The measurements are worth having for two narrower reasons: they tell you which of the labels you have been reading about actually apply to you, and if you are considering a procedure they let you describe what you want in terms a clinician can act on.
If that is where you are headed, the simulations render one change on your own photo so you can see the proportion shift rather than imagine it. It is a visualisation and nothing more — no image on this site is a surgical plan, and no measurement here is a diagnosis.
Frequently asked questions
What are the ideal facial proportions?
The two conventions in widest use are the rule of thirds — hairline to brow, brow to the base of the nose, and the base of the nose to the chin, each about a third of face height — and the rule of fifths, which divides face width into five columns each one eye wide. Both are drawing and surgical-planning conventions rather than measured population averages. When anthropometrists tested nine of these classical rules on 153 young adults, the best-fitting one held in only 40% of faces, and the vertical rules fitted worst — so "ideal" here means the canon, not the average face.
How do I find my facial ratio?
Take a photo straight on at eye level, mark the hairline, brow, base of the nose and chin, and compare the three gaps. Anything closer than roughly five per cent is indistinguishable by eye. The tools on this site do the same arithmetic from 478 landmarks rather than from four hand-placed dots.
Are facial proportions the same as the golden ratio?
No. The thirds and fifths are equal divisions — 1:1:1 and 1:1:1:1:1. The golden ratio is 1:1.618, an unequal division, and it was applied to faces long after both older rules. They are three different claims and are often quoted together as though they were one.
Do facial proportions determine attractiveness?
They contribute, weakly. Symmetry and averageness both correlate with rated attractiveness in published work, but the effect sizes are modest and skin quality often outperforms geometry in the same studies. Proportion is one input among several, not the mechanism.
Can facial proportions change with age?
Yes, mostly in the lower third. Soft tissue descends, the upper lip lengthens and the philtrum stretches, so the lower third tends to grow relative to the other two across adulthood. Bone-set widths, including the distance between your pupils, are effectively fixed after the late teens. The section on how proportions shift with age has the detail.
Are facial proportions different for women and men?
Less than the drawing books imply. In the classic test of the classical canons, sex did not significantly change how often the rules fitted. Studies of specific populations do find differences in a few individual ratios between women and men, but the distributions overlap heavily, and the ratios on this site are applied the same way to everyone.
What is Bella Hadid's "perfect face ratio"?
A figure from October 2019, when London cosmetic surgeon Julian De Silva said computerised mapping found her face 94.35% accurate to the golden ratio. The press coverage did not publish the method or the photographs used, so the number cannot be checked, and the golden ratio itself is a weak standard for faces. The golden ratio calculator on this site measures your own photo instead.
Can ChatGPT analyse my facial proportions?
A general chat assistant can describe a photo and talk about proportions, but it does not place measured landmarks and show you the distances behind a ratio, so any number it gives cannot be checked. Landmark-based tools, including the ones on this site, report the points each ratio came from.
What are the face proportions used in drawing?
The usual set: eyes about halfway down the head, the base of the nose halfway between the brows and the chin, a gap of one eye width between the eyes, mouth corners under the pupils, and ears between the brow line and the base of the nose. They are construction aids for drawing a believable face, and measured faces vary around them far more than the rules suggest.
References
- Langlois, J. H., & Roggman, L. A. (1990). Attractive faces are only average. Psychological Science, 1(2), 115–121. doi:10.1111/j.1467-9280.1990.tb00079.x.
- Grammer, K., & Thornhill, R. (1994). Human (Homo sapiens) facial attractiveness and sexual selection: the role of symmetry and averageness. Journal of Comparative Psychology, 108(3), 233–242. PMID 7924253.
- Fink, B., Grammer, K., & Matts, P. J. (2006). Visible skin color distribution plays a role in the perception of age, attractiveness, and health in female faces. Evolution and Human Behavior, 27(6), 433–442. doi:10.1016/j.evolhumbehav.2006.08.007.
- Rhodes, G. (2006). The evolutionary psychology of facial beauty. Annual Review of Psychology, 57, 199–226. PMID 16318594.
- Holland, E. (2008). Marquardt's Phi mask: pitfalls of relying on fashion models and the golden ratio to describe a beautiful face. Aesthetic Plastic Surgery, 32(2), 200–208. PMID 18175168.
- Farkas, L. G., Hreczko, T. A., Kolar, J. C., & Munro, I. R. (1985). Vertical and horizontal proportions of the face in young adult North American Caucasians: revision of neoclassical canons. Plastic and Reconstructive Surgery, 75(3), 328–338. PMID 3883374.
- Farkas, L. G., Katic, M. J., Forrest, C. R., et al. (2005). International anthropometric study of facial morphology in various ethnic groups/races. Journal of Craniofacial Surgery, 16(4), 615–646. PMID 16077306.
- Farkas, L. G. (1994). Anthropometry of the Head and Face (2nd ed.). Raven Press.
- Anand, S., Tripathi, S., Chopra, A., Khaneja, K., & Agarwal, S. (2015). Vertical and horizontal proportions of the face and their correlation to phi among Indians in Moradabad population: a survey. Journal of Indian Prosthodontic Society, 15(2), 125–130. PMID 26929498.
- Soans, C. R., Mathew, K. A., Ravi, M. S., Gauthami, K., & Shersha, S. (2023). Vertical and horizontal proportions of the face and their correlation to phi in a South Indian population. Indian Journal of Dental Research, 34(2), 119–123. PMID 37787196.
- Ricketts, R. M. (1968). Esthetics, environment, and the law of lip relation. American Journal of Orthodontics, 54(4), 272–289. PMID 5238879.
- Armijo, B. S., Brown, M., & Guyuron, B. (2012). Defining the ideal nasolabial angle. Plastic and Reconstructive Surgery, 129(3), 759–764. PMID 22090249.
- Mendelson, B., & Wong, C. H. (2012). Changes in the facial skeleton with aging: implications and clinical applications in facial rejuvenation. Aesthetic Plastic Surgery, 36(4), 753–760. PMID 22580543.
- Lambros, V. (2007). Observations on periorbital and midface aging. Plastic and Reconstructive Surgery, 120(5), 1367–1376. PMID 17898614.
- Iblher, N., Kloepper, J., Penna, V., Bartholomae, J. P., & Stark, G. B. (2008). Changes in the aging upper lip — a photomorphometric and MRI-based study. Journal of Plastic, Reconstructive & Aesthetic Surgery, 61(10), 1170–1176. PMID 18639513.
Tools mentioned in this article
- Facial Thirds CalculatorUpper, middle and lower thirds as percentages — and which one not to trust.
- Golden Ratio CalculatorHow close your proportions sit to phi (1.618).
- Symmetry CheckerLeft against right across six landmark pairs.
- Attractiveness TestAm I pretty? Your 1-10 score against 102 research faces, formula shown.
- Pupillary Distance (PD)Your PD in millimetres, using your iris as the ruler.
Measurements on this site are for information only. Nothing here is medical advice, and no result is a diagnosis. Talk to a qualified clinician before making any decision about a procedure.